IMAGE: FLICKR
IN 1995 MORE than half of all Nepalis—55% of the population—eked out an existence on less than $2.15 a day. By 2023 that figure had tumbled to 0.37%. The speed of the transformation is, by the World Bank’s own reckoning, unmatched among comparable economies anywhere in the world.
The country ended extreme poverty while fighting a civil war that cost more than 13,000 lives. It sustained growth through an earthquake, a border blockade and a pandemic. It built a remittance infrastructure that functions as perhaps the world’s most sophisticated informal social protection system.
Yet the headline obscures a harsher reality. At Nepal’s current pace, the country will not reach upper-middle-income status for more than twenty years, reckons that same institution. If today’s growth rates persist to 2050, Nepali incomes will reach only 65% of those in structural peer countries—Bangladesh, Bolivia and the Kyrgyz Republic—and less than one-third of those in wealthier aspirational peers such as Cambodia, Laos and Moldova.
The poverty reduction was not built on foundations that generate lasting prosperity. It was built on remittances: money sent home by Nepalis working abroad. And that model, remarkable as it has been, is hitting its limits.
To understand Nepal’s predicament, it is necessary to grasp how comprehensively the country has organised its economic life around migration. Between 1996 and 2023 authorities issued more than 6.6m new labour approvals to migrant workers. By 2023 more than 7% of Nepal’s total population was living abroad—the great majority young men, typically 28 years old, working in construction and services across the Gulf and Malaysia. Remittances tripled from an average of 7% of GDP during the conflict period of 1996–2006 to nearly 25% of GDP during the years of repeated shocks between 2015 and 2023.
Nepal now ranks among the top ten remittance-receiving countries in the world by share of GDP. These flows accounted for more than 30% of Nepal’s poverty reduction between 2011 and 2023. They financed household consumption, repaid migration loans, put children through school and provided an informal insurance system that formal institutions could not. During the covid-19 pandemic, the World Bank notes, the correlation between labour income shocks and economic distress was near zero for migrant households compared with non-migrant ones.
But remittances also distorted the economy in ways that are now compounding. They sustained private consumption—which reached 80% of real GDP on average during 2015–23, a share that stands in brutal contrast to Nepal’s peers. They funded imports rather than production. And, critically, they appreciated Nepal’s real exchange rate in a way that progressively undermined the country’s ability to export anything else.
The World Bank provides the first comprehensive firm-level evidence of the damage. Nepal’s real effective exchange rate has appreciated by approximately 35% since the country fixed its currency to the Indian rupee in 1993—a peg that has not been adjusted since.
The surge in remittances alone accounts for roughly half of that appreciation. For every 10% increase in bilateral real exchange rates, Nepal’s exports sink by 3%. The cumulative effect has lowered merchandise exports by more than 10. The country’s exports-to-GDP ratio tells the full story: from over 25% in the late 1990s, it collapsed to just 6.8% in 2022. A mere 0.5% of those manufacturing exports were classified as high-tech—well below the share in several peer countries.
Nepal’s economy grew at a real rate of 4.2% a year between 1996 and 2023, which sounds acceptable until placed in context. Within South Asia, that rate ranked sixth out of eight countries, ahead only of Pakistan and Sri Lanka. Structural and aspirational peers outperformed Nepal in every sub-period.
The country’s economic history divides into three chapters. During the armed conflict with the Communist (Maoist) Party of Nepal from 1996 to 2006, average growth was 4%, below the 4.4% of structural peers and significantly below the 5.9% of aspirational peers. The post-conflict period from 2007 to 2014 offered a peace dividend that largely failed to materialise. Growth inched up to 4.6%, but political instability and frequent changes of government meant the economy could not capitalise on the end of hostilities.
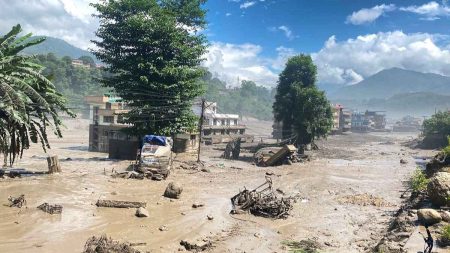
The third period, 2015–23, was defined by the Gorkha earthquake, India’s economic blockade, a major landslide and the pandemic. Against that backdrop, 4.2% annual growth reflected real resilience, driven almost entirely by remittances absorbing the worst effects of each successive shock. Capital accumulation was the primary driver of long-run growth. Total factor productivity—the engine of lasting development—contributed effectively nothing, and during the most recent period vanished entirely.
The income gap has widened accordingly. Nepal’s GNI per capita stood at 39% of structural peers’ levels in 1996 and had risen to only 50% by 2023. Against aspirational peers, the position deteriorated from 49% in 1996 to just 40% in 2023. The World Bank’s projections find no realistic path to closing those gaps under current conditions.
If GNI per capita and the upper-middle income threshold continue growing at their historical rates, Nepal would take approximately two decades to reach upper-middle-income status—without narrowing the income gap with either peer group in the process.
One of the most disquieting aspects concerns manufacturing. In almost every developing economy that has successfully broken out of the lower-income trap, industry served as the engine: absorbing surplus agricultural labour, transmitting technology, raising productivity and building the export base.
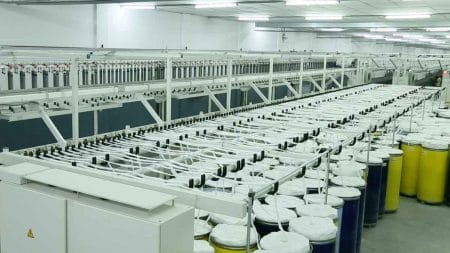
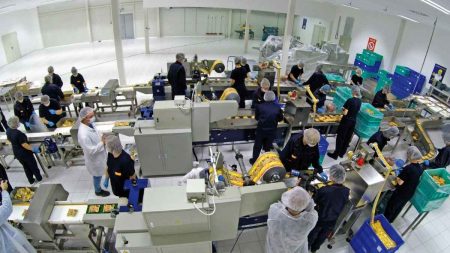
Nepal’s manufacturing sector has done none of those things. It has been in steady, uninterrupted decline. Manufacturing’s share of real GDP fell from 7.3% during the conflict period to 5.7% during the recent period of repeated shocks. Construction has overtaken it as the largest sub-sector of industry, but both contracted in 2023 following import restrictions. The industry sector as a whole has held at a low 14% of real GDP, contributing only 0.8 percentage points of growth on average.
The explanations are structural. A 1 percentage point increase in input tariffs leads to a 2% reduction in exports, and tariff increases between 2011 and 2021 resulted in roughly 8% lower exports over the same period. The duty drawback system meant to offset this burden is difficult to access in practice, particularly for smaller firms. Weak competition in transport and logistics, entrenched through syndication arrangements, further raises trade costs.
Nepal ranks in the lowest global quintile on market competition according to the World Bank. Scheduled to graduate from Least Developed Country status this year, Nepal faces the additional prospect of losing the preferential trade access it currently receives in major markets, with no free trade agreements in place with countries outside the region.
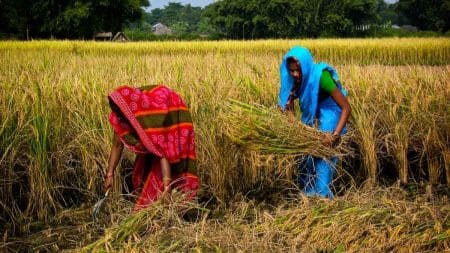
Nepal’s labour market reflects those deficiencies. The employment ratio declined on an annual basis between 2000 and 2022. Non-agricultural employment in 2022 was lower than in comparable economies. Labour productivity is the lowest among Nepal’s peer countries, particularly in agriculture and industry. More than 80% of Nepal’s workforce is in the informal sector. Women face particular disadvantages. While Nepal has a higher female employment ratio than many South Asian countries, most of those jobs are informal, in agriculture and in low-productivity roles.
The slower creation of non-agricultural jobs has disproportionately hurt women. Gender gaps in digital skills, computer ownership and access to formal financial services compound the disparity. Targeted policies—increasing trade openness, improving access to finance and raising educational outcomes—could lift the non-agricultural employment ratio by up to 3 percentage points over the long run. That is not a small number for a country where agricultural employment still accounts for a dominant share of the workforce.
For many Nepali families, migration has been a lifeline. Yet the full cost of the system is poorly understood—by the workers who enter it and by the institutions that manage it. Migration from Nepal is expensive. Workers typically rely on informal loans at high interest rates to finance recruitment, travel and documentation.
Repaying those loans is the most commonly cited use of remittances after daily consumption. Access to more lucrative destinations—Western countries, East Asia, the Pacific—remains heavily concentrated among wealthier households. Migrants from the wealthiest decile remit more than five times as much as those from the poorest. Yearly deaths of Nepali migrant workers have exceeded 1,000 in recent years. Workers face contract fraud, employer exploitation and the withholding of legal documents.
Reintegrating returnees is no less fraught. According to the Nepal Labour Force Survey 2017–18, 14.3% of returnees were unemployed and 41.5% had dropped out of the labour force entirely. Of those who found work, more than 75% were in the informal sector. Compared with non-migrants, returnees earn less, at least initially. The skills acquired abroad rarely map onto formal domestic job requirements—and programmes to bridge that gap are currently limited and out of reach for most.
Nepal holds an estimated 83,000 megawatts of hydropower potential, of which 42,000 MW are considered economically viable. Installed capacity at the end of 2024 stood at some 2,990 MW, about 4% of Nepal’s total potential. India has tapped 29% of its hydropower resources. Pakistan, 17%.
There has been progress. Total installed capacity tripled over the past decade. Independent power producers now account for 64% of total installed capacity and were responsible for more than 70% of the capacity added since 2018. But the obstacles are formidable. The Electricity Act of 1992 remains in force. The Nepal Electricity Authority has been reluctant to adopt the take-or-pay clauses in power purchase agreements that financial institutions require before lending. System losses in 2024 stood at 12.7%.
The consequences for Nepali firms are tangible. Biofuels and agricultural waste accounted for more than 90% of Nepal’s domestic energy production in 2022. Seventy-six percent of firms experienced regular power cuts. Over 13% reported losses exceeding 10% of annual sales. Thirty-six percent relied on diesel generators as a coping mechanism.
The government has set a target of 28,500 MW of installed capacity by 2035. The current project pipeline of roughly 10,000 MW falls well short of that ambition. Achieving it would require solving the financing problem—a domestic bond market, a public-private partnership framework and foreign currency risk management tools—while simultaneously reforming the regulatory environment and upgrading the transmission grid.
Nepal’s digital sector is, by regional standards, surprisingly competitive in one narrow area: exporting digitally delivered services. ICT services accounted for over 8% of Nepal’s total service exports and 4% of total exports in 2023. Digitally delivered service exports grew at a compound annual rate of 11.6%, compared with 5.8% for non-digital services.
Nepal trails only Pakistan in ICT service exports as a share of GDP within the region. The private sector contributed Rs7.1bn to ICT investment between 2017 and 2023 across 109 industries, creating 6,746 jobs. Platforms such as Daraz Nepal, which grew from 2,500 to 20,000 registered sellers in five years, illustrate the potential when digital platforms achieve scale. Nepal’s low-wage structure and English-speaking workforce give it a comparative advantage in business process outsourcing.
The obstacles lie on the infrastructure, cost and skills side. Nearly half the population lives more than 10 kilometres from fibre-optic infrastructure. Fixed broadband costs 7.8% of average GNI per capita. Entry-level smartphones, heavily taxed, consume 33% of average monthly income. Internet usage rose from 3.3% in 2011 to 38% in 2021 but computer ownership is at just 15%. Only 10% of manufacturing firms used electronic payments in 2023. Nepal ranks 124th out of 134 economies on Wiley’s Digital Skill Gap Index. The government has declared 2024–34 the Information Technology Decade, though earlier comparable initiatives have not delivered anticipated results.
If Nepal continues broadly on its current trajectory, its long-term real growth will hover around 4% a year. Its income level will reach approximately 65% of structural peers by 2050, and less than one-third of aspirational peers’ levels. Upper-middle-income status, at that pace, lies more than two decades away. The government’s 16th Development Plan envisions average annual GDP growth of 7.1% until 2029. The World Bank does not say that target is impossible. What it says is that achieving it would require a sustained policy shift, which Nepal has not yet made. ■